Nakba Animated Map
” Nakba Timeline Map: One second for every depopulated Palestinian city and village” (infographic map)
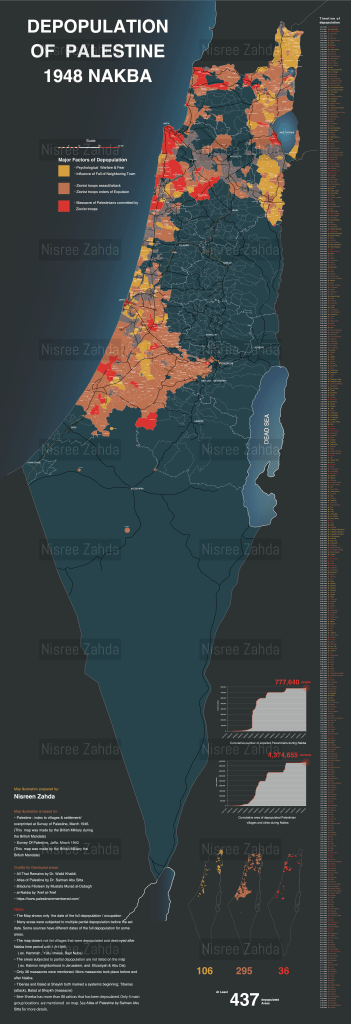
This time animated map describes the chronological order of the systemic depopulation and then the erasing of more than 437 Palestinian cities and villages during the 1948 Nakba
notes:
only three villages were evacuated after the order of Arab army
Tiberias and Balad al shekh were mentioned twice but were counted once.
Many depopulated areas also had partial depopulation dates.
This map mentioned the final date of the largest depopulation.
Only 36 massacres were mentioned. More massacres took place before and after the Nakba period
This list does not include all depopulated /destroyed areas. More areas were depopulated afterward ( such as Hamma in July 1947 & Yalu, Ammwas in 1967)
————————————-
Source: al-Khalidi, Walid (ed.). All that remains: the Palestinian villages occupied and depopulated by Israel in 1948. Washington DC: 1992.

Thank you Nisreen Zahda for doing this important work, to visually explain the Nakba to those who don’t know what happened and to future generations of Palestinians. I read about your project in Faisal Saleh’s book FROM PALESTINE: OUR PAS, OUR FUTURE.
LikeLike
Thank you Dania for your encouraging words. I am very glad that you like the Map.
Best regards
LikeLike
Thank you for the powerful visual representation of the now well-known overall fact of violent depopulation of the Palestinian villages and towns during the Nakba. Seeing it visualised day by day gives back to the numbers their awful pain and fatality they carry.
Isn’t there a typo in the year in the notes? In stating “More areas were depopulated *AFTERWARD* (such as Hamma in July 1947…”
– According the sources it should rather say “in July 1949”.
LikeLike
Hi Elena ,
thank you for the message and for the correction. I didn’t notice the typing error. Yes, you are right, it should be 1949.
Best Regards
LikeLike